
Imagine looking at the oldest family photograph in existence. There are no people, houses, or trees in it. All you see is light left over from a time when the universe was about 380,000 years old. That light has traveled for billions of years before reaching our telescopes, and today it fills the entire sky as an almost imperceptible microwave glow. Astronomers call it the cosmic microwave background.
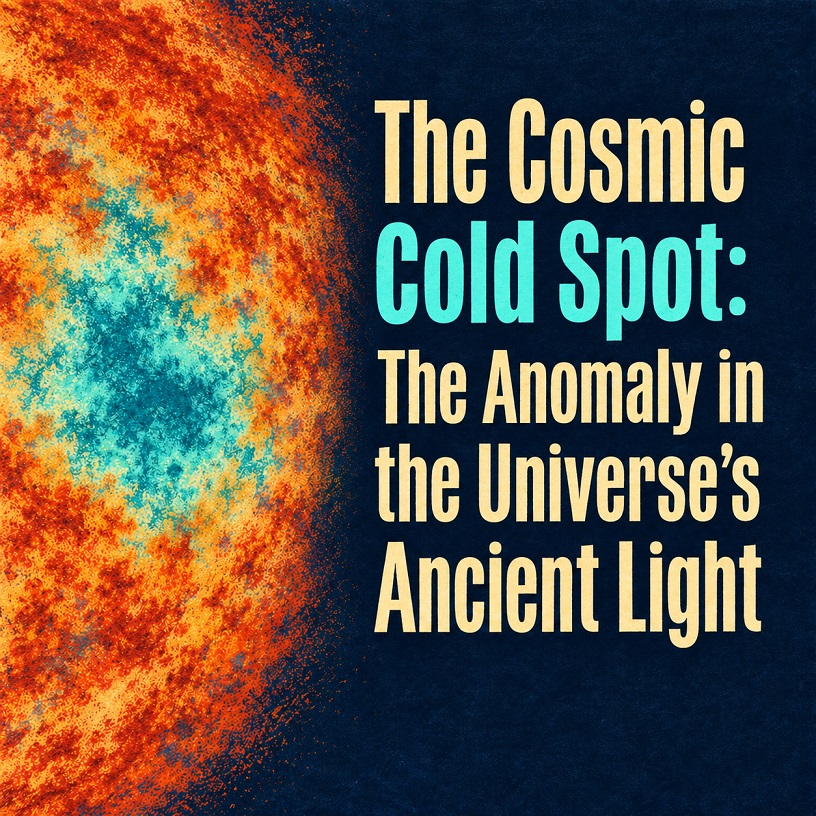
When scientists construct a detailed map of this ancient glow, they notice something unusual. In the direction of the southern constellation Eridanus lies a broad region that appears colder than expected compared with the surrounding parts of the map. It has become known as the Cosmic Cold Spot, or CMB Cold Spot. This is not an icy hole among the stars. It is an unusual pattern in the temperature of the oldest light we can observe directly.
Why does this feature fascinate cosmologists? Because the microwave background is an archive of the early universe. Understanding the Cold Spot can teach us about primordial fluctuations in matter, immense cosmic structures, and the limits of our statistical models. The story begins with an astonishing fact: the universe has preserved a memory of its own childhood.
The Oldest Light: How the Universe Left Behind Its Portrait
Early in its history, the universe was so hot that ordinary atoms could not remain stable. Electrons and atomic nuclei formed a plasma in which photons were constantly scattered. Imagine trying to see across a busy square while thick fog surrounds you. Light repeatedly changes direction, preventing you from seeing far ahead. The physical cause was different in the young universe, but the result was similar: space was opaque to light attempting to travel freely.
As the cosmos expanded, it cooled. About 380,000 years after the beginning of its hot early phase, the temperature fell enough for electrons and nuclei to combine into neutral atoms, mostly hydrogen and helium. This stage is called recombination. With far fewer free electrons available to scatter photons, light could begin traveling enormous distances without continually colliding with them.
Those very photons reach us today. The expansion of space has stretched their wavelengths so dramatically that radiation originating in a hot environment is now observed mainly in the microwave range. Its average temperature is approximately 2.725 kelvin, only a few degrees above absolute zero.
Here is the fascinating part: the temperature is not precisely identical in every direction. After astronomers remove the effects of our motion and other known signals, tiny temperature differences remain, generally on the order of tens to hundreds of microkelvin. One microkelvin is one millionth of a kelvin. If the background’s average temperature were represented by the height of an enormous mountain, these variations would resemble minute irregularities on its surface.
Why do those irregularities exist at all? Because the young universe was not perfectly uniform. It contained small fluctuations in density, temperature, and gravitational potential. Over billions of years, gravity amplified some of those differences, helping galaxies, clusters, and cosmic filaments to form. The microwave background is therefore more than a picture of the past: it is a key to the origin of the structures we see today.
It is against this background that the Cold Spot appears. It is not a separate object that we could approach in a spacecraft. It is an area of the sky where the measured temperature pattern differs from the surrounding picture and deserves particular statistical attention.
How Scientists Discovered the Unusual Region
In 1965, Arno Penzias and Robert Wilson discovered the cosmic microwave background. Later, the COBE satellite confirmed its extraordinarily precise, nearly ideal thermal spectrum and measured its tiny temperature variations. This marked the beginning of a new era: rather than relying solely on light from galaxies, cosmologists gained access to a signal from before stars and galaxies existed.
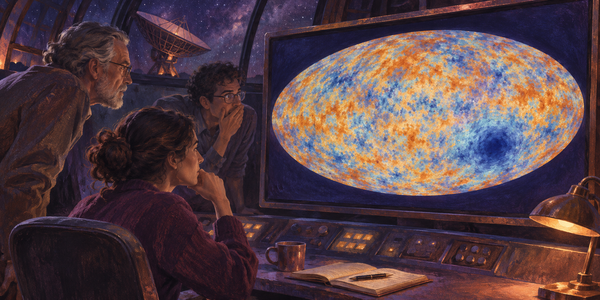
The next major advance came with NASA’s WMAP spacecraft, which mapped the microwave sky in much greater detail. Analyzing these data in 2004, Marcos Cruz and colleagues drew attention to an unusual cold structure in the southern sky. It became especially prominent under a particular type of processing called the spherical Mexican hat wavelet, a mathematical filter that emphasizes structures of a chosen angular size.
It is worth stopping here. Why would scientists use a filter? Imagine examining a large photograph of a beach while searching for waves roughly ten meters wide. If you focus only on individual grains of sand, you will miss the larger shapes. If you smooth the image too aggressively, you will lose important detail. An appropriate filter highlights the scale that interests you. In cosmology, such mathematical tools help reveal structures hidden among many smaller fluctuations.
The Cold Spot extends across several degrees of the sky, and researchers often discuss a characteristic angular scale of around ten degrees. For comparison, the full Moon appears about half a degree wide. We are therefore dealing with a large region on a celestial map, not a tiny dot.
Later, the European Space Agency’s Planck mission measured the microwave background using different instruments, frequency channels, and processing methods. The Cold Spot remained visible in those maps. That matters because it indicates the feature is not simply an accidental defect in one particular instrument. Yet confirming an observed structure does not automatically mean its origin lies beyond standard cosmology. Those are two different claims, and science tests them separately.
Furthermore, maps of the microwave background are not ordinary photographs. Astronomers must carefully separate the microwave emission of our own Galaxy, signals from dust and charged particles, and instrumental influences. Different methods for removing these components help determine whether a feature belongs to the cosmic background. The Cold Spot has been investigated with precisely that caution.
How Cold Is the Cold Spot, and Why Does It Matter?
Hearing the words “Cold Spot,” it is easy to imagine a place where the temperature is dramatically lower than elsewhere in the universe. In reality, the measured difference is extraordinarily small. It is on the order of tens to roughly a hundred microkelvin relative to the average, depending on the filtering method and the precise definition of the region. This is not a place where stars freeze or matter suddenly loses its heat.
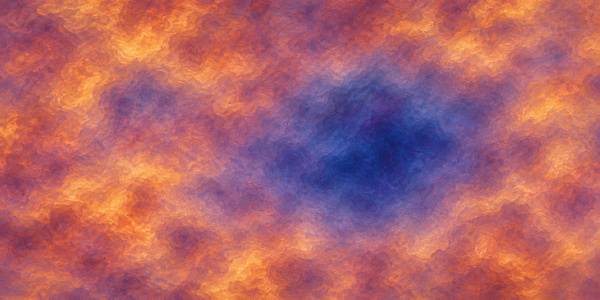
A more accurate description is that the microwave sky in this direction has an unusual temperature profile. Some analyses reveal a colder central area surrounded by a comparatively warmer ring. The significance of the feature comes not merely from its lowest temperature but from the combination of temperature, size, and shape.
Consider an everyday example. Imagine recording daily temperatures over many years. One exceptionally cold day does not prove that the climate has changed its underlying laws. But if you discover a long sequence of days following an unusual pattern, you will want to check how frequently such sequences appear in historical records. Cosmologists likewise examine not just one low temperature but the statistical structure of the entire region.
The standard cosmological model, commonly called ΛCDM, predicts the statistical properties of temperature fluctuations. It does not predict in advance the exact temperature at every individual point in our sky. Like a mathematical description of the results of many dice rolls, the model specifies probabilities and patterns rather than the precise sequence of every throw.
When we observe a rare-looking structure, the question becomes: how unusual is it compared with skies generated according to the same model? The answer depends on the statistical test chosen. Some analyses of the Cold Spot find deviations around two to three standard deviations, or somewhat higher under specific settings. That is enough to generate serious scientific interest, but it is not equivalent to discovering a new physical law.
The reason is familiar to anyone who has searched through large amounts of data. If you examine thousands of different locations, sizes, and shapes, you will eventually find something striking even when all the measurements arise from an ordinary statistical process. In science, this relates to the problem of multiple comparisons, sometimes called the look-elsewhere effect. The significance of a feature noticed after searching the entire sky must account for how that feature was selected.
None of this makes the Cold Spot uninteresting. Quite the opposite: it is an excellent example of the encounter between a real observation and the difficult question of how to interpret statistical rarity. Cosmology requires both imagination and discipline: the willingness to ask bold questions and the ability to distinguish the unusual from the demonstrably new.
Could an Enormous Cosmic Void Have Cooled the Light?
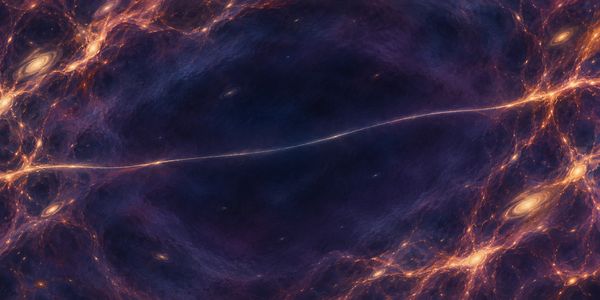
One of the most widely discussed explanations connects the Cold Spot with a gigantic underdense region located between us and the ancient surface from which the microwave radiation originates. Such regions are called cosmic voids. They are not entirely devoid of matter, but they contain fewer galaxies and less mass than the average for a comparable volume.
Why would a void affect light? The answer involves gravity and the expansion of the universe. Photons passing through large gravitational structures can experience a change in energy if the gravitational potential evolves during their journey. This phenomenon is known as the integrated Sachs–Wolfe effect, or ISW effect.
Let us picture it as a bicycle journey. Imagine riding downhill into a valley and then climbing the opposite slope. If the landscape remains unchanged, the energy gained during the descent is balanced by the energy lost during the climb. But if the shape of the valley changes while you are passing through it, that balance is altered. The analogy is simplified, yet it captures the central idea: when a gravitational potential changes over time, a photon can emerge with slightly different energy than it would have had in an unchanging potential.
In an expanding universe, especially during an era of accelerated expansion, the gravitational potentials associated with large structures can weaken. Under certain conditions, passage through a cosmic void produces a weak negative temperature signal in the microwave background. This makes the idea of a large void along the Cold Spot’s line of sight physically grounded and testable.
Observational studies have indeed identified large underdense structures in this direction, including the so-called Eridanus Supervoid discussed in the scientific literature. Astronomers investigate it using maps of galaxies and their distances. They can then ask whether the ancient light passed through a structure capable of contributing to the observed signal.
Here, however, we encounter a crucial limitation: finding a supervoid does not prove that it explains the entire Cold Spot. Within the standard cosmological model, the expected ISW signal from such a structure is generally weaker than the full observed feature. Results depend on its geometry, depth, distribution of matter, and the measurement method. Scientists therefore consider the supervoid a potential contributor rather than a definitive solution.
This is a particularly interesting moment in the scientific story. Sometimes we find a real object exactly where a hypothesis predicts one should exist, only for calculations to show that its effect is insufficient. The discovery remains valuable because it narrows the possible explanations and demands more accurate measurements. In cosmology, a good question often leads to new maps, better models, and even more fascinating questions.
A Chance Fluctuation or a Sign That Our Model Is Incomplete?
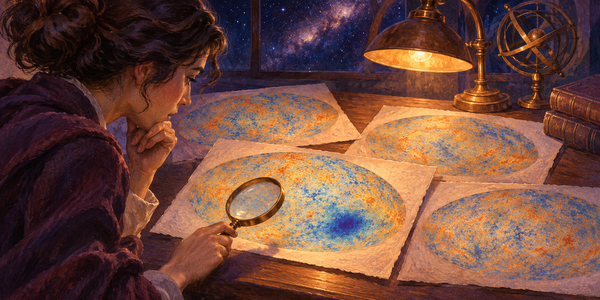
One of science’s hardest tasks is deciding when an unusual observation requires a new theory. The cosmic microwave background contains millions of measurements, but we have only one observable sky. We cannot rewind time and observe thousands of independent universes under identical conditions. Cosmologists therefore rely on mathematical models and computer simulations to determine what kinds of temperature maps are compatible with a given theory.
Imagine shuffling a deck of cards and drawing several cards of the same suit in a row. It looks remarkable, but it does not mean the deck is magical. Shuffle often enough, and unusual sequences will occur. To establish whether anything is wrong, you must define in advance exactly what you are measuring and compare the result with the expected distribution.
The Cold Spot raises a similar question. It is part of the real microwave background map, and some of its statistical characteristics are unusual. But how unusual? The answer changes depending on whether we examine temperature alone, a particular angular scale, the region’s shape, or a broader collection of anomalies. That is why different scientific papers report different estimates of its significance.
The ΛCDM model has achieved impressive successes. It describes much of the measured statistical spectrum of microwave background fluctuations, the distribution of large-scale cosmic structure, and numerous other observations with remarkable accuracy. An unusual feature in the sky must be considered in that context. The model is not assumed to be infallible, but neither is it rejected merely because it permits a rare-looking result.
At the same time, cosmologists do not ignore anomalies. They are useful precisely because they show where our assumptions deserve closer scrutiny. Possible lines of investigation include a better understanding of structures between us and the microwave background, improved statistical methods, and studies of the physics of the early universe.
It is essential to distinguish between two ideas: “not yet fully explained” and “incompatible with known physics.” The first means researchers are still discussing the relative contributions of different mechanisms and the statistical interpretation. The second would require much stronger evidence. There is no generally accepted proof that the Cold Spot violates the standard cosmological model.
That discipline is what makes the story compelling. It does not diminish the mystery; it gives the mystery substance. Researchers are not satisfied with a striking image. They want to know which mechanism produces the signal, how strong that signal should be, and whether the same mechanism leaves other traces we can measure.
Where Did the Idea of a Collision Between Universes Come From?
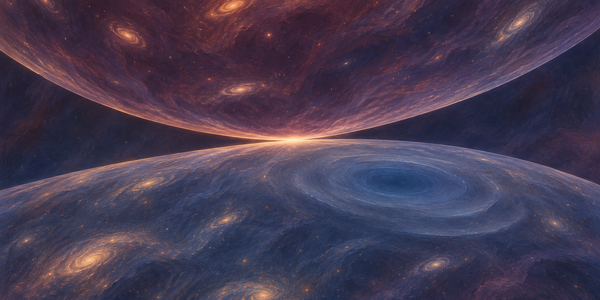
Among the boldest proposals associated with the Cold Spot is the hypothesis of an interaction between our observable region and another “bubble” universe. The idea arises from certain models of cosmic inflation, a period of extremely rapid expansion in the universe’s very early history. In some theoretical scenarios, inflation can produce separate regions with different histories, figuratively described as bubbles.
If two such regions interacted, theoretical models suggest that the event could leave a characteristic imprint on the microwave background’s temperature distribution. That possibility led researchers to ask whether the Cold Spot could be a remnant of such an ancient encounter.
Imagine two drops spreading across a wet surface. If they meet, the boundary between them can leave a recognizable shape. This image helps explain why physicists search for circular or approximately symmetrical signatures. But the analogy does not mean that universes are literal material bubbles floating through ordinary space, nor does it mean that such a collision has been observed.
The challenge facing the hypothesis is the standard of evidence. One unusual cold region is not enough to confirm the existence of other universes. A specific model must predict clear observational signatures that can be distinguished from ordinary temperature fluctuations and the effects of intervening cosmic structures. Those predictions must be tested with statistically reliable methods and, wherever possible, independent observations.
At the current stage of research, there is no confirmed observation of a collision between universes. The Cold Spot is not evidence establishing a multiverse. The idea remains a theoretical possibility within particular models, attracting interest because it raises the question of whether the microwave background contains information beyond the simplest description of the early universe.
The distinction between a bold hypothesis and an established result matters enormously. Genuine scientific courage does not mean declaring the most dramatic interpretation to be true. It means formulating testable predictions and accepting the observational outcome, whether or not it supports our favorite idea.
How Telescopes and Computers Investigate the Mystery
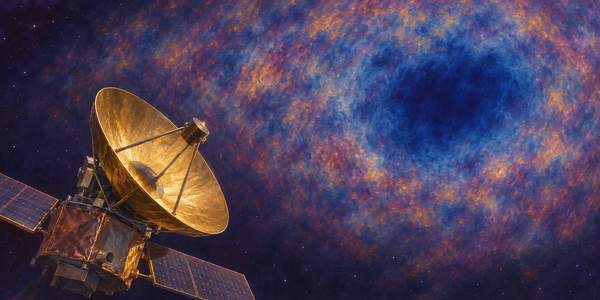
Investigating the Cold Spot resembles detective work in which photons are the witnesses and statistical patterns are the clues. The first task is to measure the microwave background as accurately as possible. Scientists observe at different frequencies so they can distinguish the cosmic signal from emission produced by dust, gas, and other components of the Milky Way.
The second task is to map the matter lying in the same direction. Imagine hearing an unusual sound in your home. Rather than immediately concluding that an unknown device caused it, you check nearby rooms, the plumbing, and the street outside. Astronomers similarly investigate whether galactic structures between us and the microwave background could alter the signal.
They use large observational surveys to measure the positions, brightnesses, and distances of galaxies. Some distances are estimated through spectroscopy; others come from photometric methods that analyze brightness and color in different wavelength bands. Each technique has strengths and limitations. Combining them allows researchers to construct three-dimensional maps covering enormous volumes.
The third task is calculating the effect a particular structure should produce. If a supervoid lies in the direction of the Cold Spot, models must predict how it influences photons passing through it. This requires general relativity, models of cosmic expansion, and information about the distribution of matter. The predictions are then compared with the actual temperature map.
The fourth task is statistical testing. Computers generate numerous simulated maps of the microwave background according to a chosen model. Scientists apply the same search procedures to these simulations that they used on the real sky. They can then determine how often regions resembling the Cold Spot appear. This is much more reliable than simply deciding that a particular shape looks strange.
The fifth task is looking for independent signatures. Microwave background polarization, statistical correlations with galaxy maps, and gravitational-lensing measurements can help distinguish competing explanations. Every additional type of observation is like another witness describing the same story from a different perspective.
This illustrates why modern cosmology is simultaneously observational, theoretical, and computational. Telescopes collect the light. Physical theories describe the processes that have altered it. Computers test whether the observed patterns are expected or unusual. None of these tools is sufficient on its own.
What the Cold Spot Teaches Us About Science and the Universe
The most exciting part of the Cosmic Cold Spot’s story is that everything begins with a temperature difference no human body could ever feel. A few dozen microkelvin on a map of ancient light have been enough to inspire decades of research, new galaxy surveys, and serious questions about the evolution of the cosmos.
It is a wonderful example of the power of scientific measurement. In everyday life, we often trust most readily what we can see directly. Yet nature’s most important properties are not always visible to the naked eye. Electricity flowing through a wire, microscopic cells, and the gravitational influence of distant galaxies reveal themselves through appropriate instruments and careful analysis. The Cold Spot belongs to the same tradition: the world becomes richer when we learn how to measure what we cannot see.
The story also reminds us that science does not advance only through final answers. Sometimes the most productive result is a well-formulated question. The Cold Spot encourages us to compare statistical methods, investigate cosmic voids, and test models of the early universe. Even if it is ultimately explained as a rare but permissible fluctuation within standard cosmology, the work devoted to understanding it will have enriched our knowledge.
If an additional physical cause is established, it will need to fit the broader picture drawn by independent observations. That is how genuine scientific discovery works: not as a dramatic headline, but as a sequence of measurements, predictions, and tests that gradually leave less room for accidental explanations.
There is also something almost poetic about the object under investigation. The light we study began its journey before the Sun, Earth, or any living creature that has ever looked toward the sky existed. It crossed an evolving cosmic web and now reaches detectors built by a comparatively young species on a small planet. We use that light to ask questions about events that occurred billions of years ago.
The Cosmic Cold Spot is neither a proven doorway to another universe nor a gigantic icy wasteland. It is a real feature in the map of the oldest observable light, one whose interpretation requires cosmology, statistics, and the study of large-scale structure. That is precisely why it is so captivating. It shows that even when we have measured the sky with extraordinary precision, it still has the power to surprise us.
The next time you look at the night sky, think about the light your eyes cannot see. It fills space in every direction and carries traces of a time before the first stars existed. In one region of that ancient map, an unusually cold pattern stands out. And in our effort to understand its history, one of cosmology’s most beautiful qualities becomes clear: the universe does not merely exist before us-it has left clues from which we can reconstruct its past.
Author: Vasil Stoyanov